Spotted Crake habitat use 127
©Wildfowl & Wetlands Trust
Wildfowl
(2013) 63: 115–134
the vegetation consisted of a distinct
aggregation of reed swamp and developing
willow scrub with a very distinct understorey
of
E. angustifolium
, Common Yellow Sedge
Carex demissa
and Jointed Rush
Juncus
articulatus
(although these varied locally
in relative abundance). The other two
management units were more similar to each
other, comprising a more terrestrial open
acidic dry grassland vegetation, typified by
the grasses
Agrostis stolonifera, Festuca rubra
and
Poa pratensis,
a uniform Purple Moor Grass
Molinia caerulea
sward type and an open wet
rush pasture community, typically dominated
by
Juncus effusus
and Flote-grass
Glyceria
fluitans
, none of which were apparently ever
used by the radio-tagged crakes, despite their
local abundance and domination of large
areas in both management units. In contrast,
the very wet rush pasture dominated by
J. effusus
with encroaching
Salix
scrub, the
open water communities, with or without
emergent
Typha latifolia
beds and the more
dense and wet Orange Foxtail
Alopecurus
aequalis
and
Glyceria fluitans
acid wet grassland
were frequently used by the tagged crakes.
Hence, with the evident exception of the
very driest and open vegetation communities,
the birds appeared to use a very wide range
of differing habitat types and essentially
seemed to use most vegetation types present
within their home ranges.
0
1
2
0
10
20
30
40
50
60
% vegetation cover (arc sine
square root transformed)
Mean depth of water above soil surface (cm)
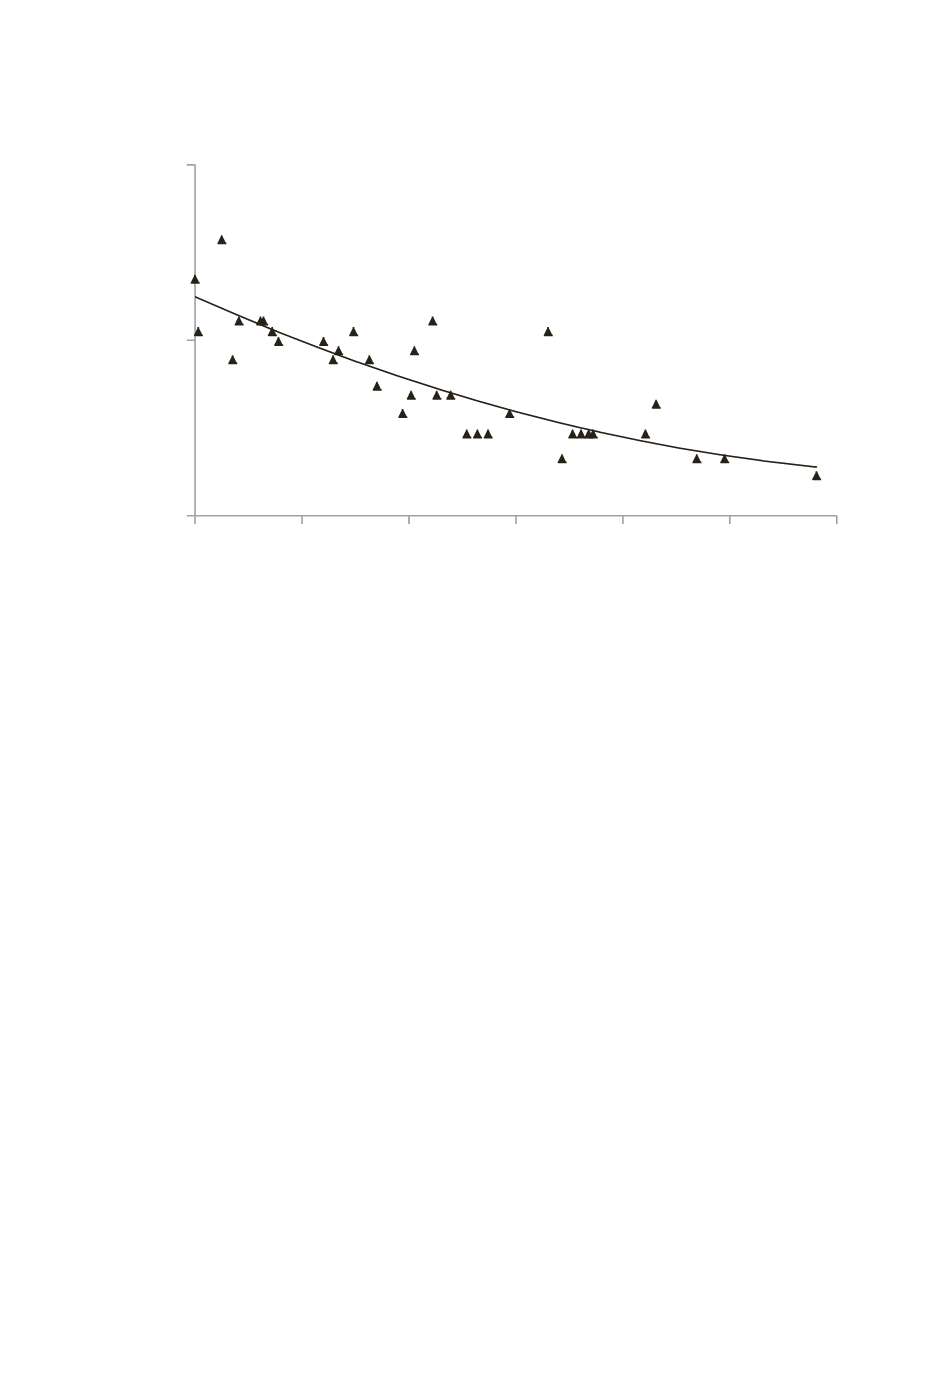
Figure 5.
Relationship between arc-sine square-root transformed percentage vegetation cover (
v
) in
1 m × 1 m vegetation quadrats against the mean water depth (
d
) measured in 10 random positions in
the management units occupied by the radio-tagged Spotted Crake in Territory 1 at Lille Vildmose. The
fitted regression model has the formula
v
= 0.0002
d
2
– 0.0273
d
+1.2485,
r
= 0.85,
F
2,35
= 44.0,
P
< 0.001. Note that vegetation cover was always 100% in Territories 2 and 3, so comparable data were
not available for these management units.


