Survival and dispersal in a new Barnacle Goose population 83
©Wildfowl & Wetlands Trust
Wildfowl
(2013) 63: 72–89
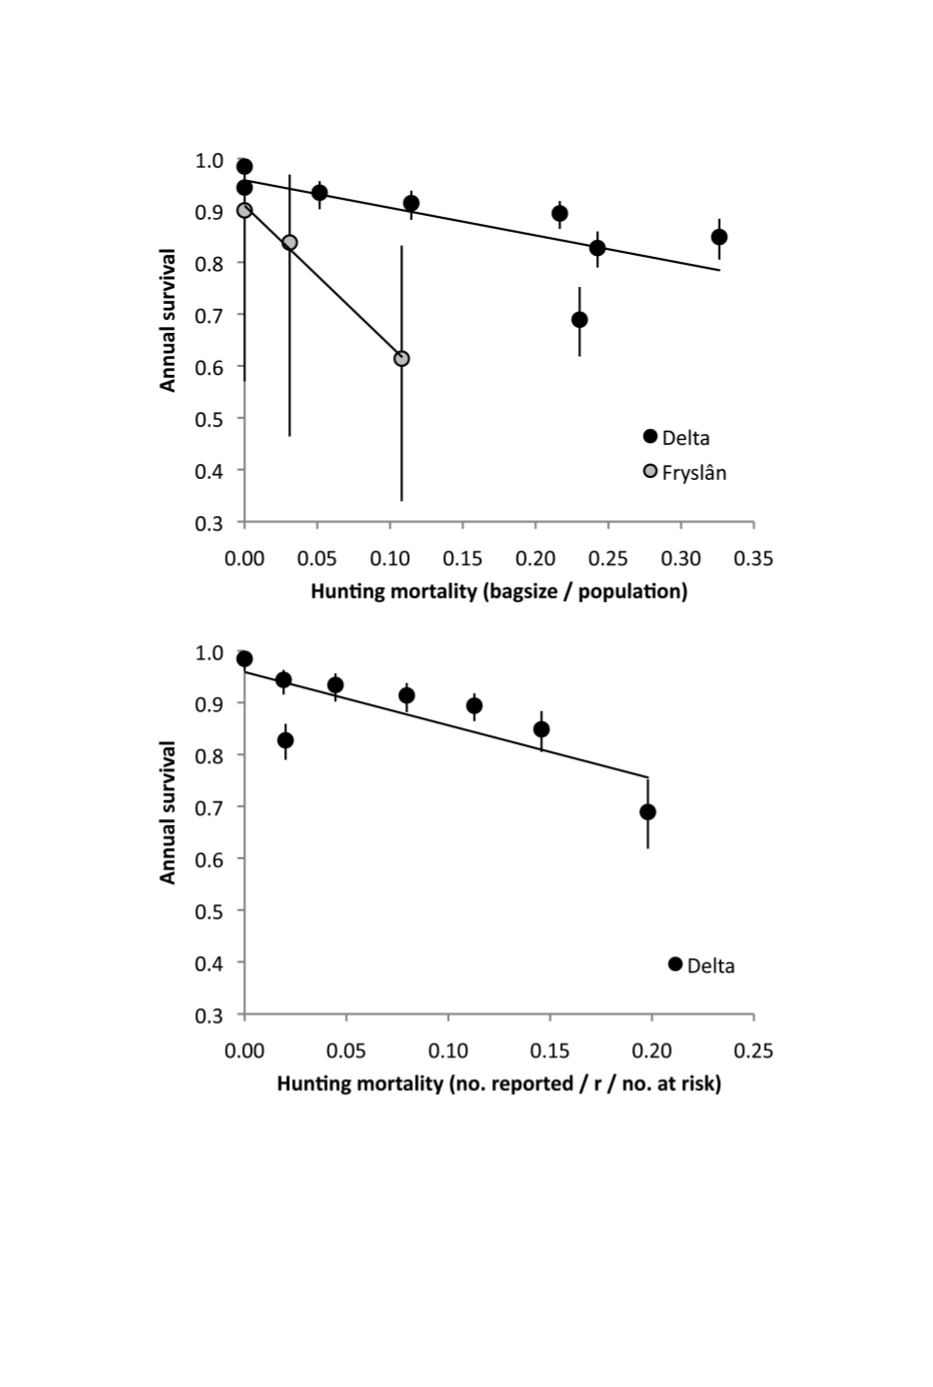
Figure 2.
Annual survival rates for Barnacle Geese breeding in the Netherlands (in the Delta area and
in Fryslân), in relation to two mortality estimates attributable to hunting (Table 4). Values shown are
from the best models for both areas, described in Table 2. (a) = hunting mortality calculated as the bag
number divided by the total population size, (b) = hunting mortality calculated as the number of marked
birds reported shot divided by the reporting rate (r) divided by the number of birds at risk (see text).
Vertical lines represent 95% confidence intervals.
(a)
(b)


